We cut through the hype to show you what really matters in speaker specifications.
It's often stated that the quality of a speaker is subjective, but studio monitors are measurement instruments: they measure the sound of your audio material, be it speech, music or sound effects. Measurement instruments should report exactly what they're measuring. If they report a value that's too high or low, decisions based on those values will be wrong or inappropriate. Consider a voltmeter that's used to measure a 9V battery. If the result is less than 8V, you have a dead battery, can put it in the recycling, and get a new one. Just below 9V tells you the battery needs replacing now or very soon. Just over 9V gives you confidence that you can continue using the battery for some time. (If the reading is 12V, the meter is broken or you've discovered a new branch of physics!)
Peter Walker, of Quad fame, is often quoted as saying "If you do not like the output, take a look at the input," and he's right: if you don't like what a well-installed, good-quality monitor tells you is in your audio signal, it's your audio material that needs looking at.
Of course, Mr Walker's statement assumes that the thing in the middle is doing its job properly. So how do we know if a loudspeaker is telling us the truth? The answer has two parts: first, examination of published specifications, and second, the installation of the speaker into the room. In this article, I'll focus on the first part. (The second, which necessarily includes the acoustical treatment of the room, must not be overlooked but has been discussed in dozens of previous SOS articles.) Note that real graphs are used to illustrate points in the text, and in some cases these refer to specific brands or models, but that's simply to ensure I'm using real-world examples; I don't intend these (or any pictures) to promote specific brands or products over each other. Rather, I want to arm you with the information and understanding required to make good choices for yourself.
Frequency Response
Leaving aside cabinet dimensions and weight, the 'frequency response' is probably the most quoted loudspeaker specification. Unfortunately, it's open to abuse, and what's quoted in marketing material can often mislead. The target response is, of course, a flat line within the 'pass band' (the range of frequencies the loudspeaker is intended to reproduce) at the listening position. No matter how flat the speaker is in anechoic conditions (where there is, by definition, no room effect), the room will affect the response of both the speaker itself and the sound during its path from speaker to listener. Unlike in live-sound and domestic environments, a recording studio's listening position can be well defined. But the speaker designer cannot be sure about many other influencing factors — the listening distance, for example, or the presence of and distance to nearby boundaries (walls, ceiling, floor, mixing desk and so on), acoustic treatment and more.
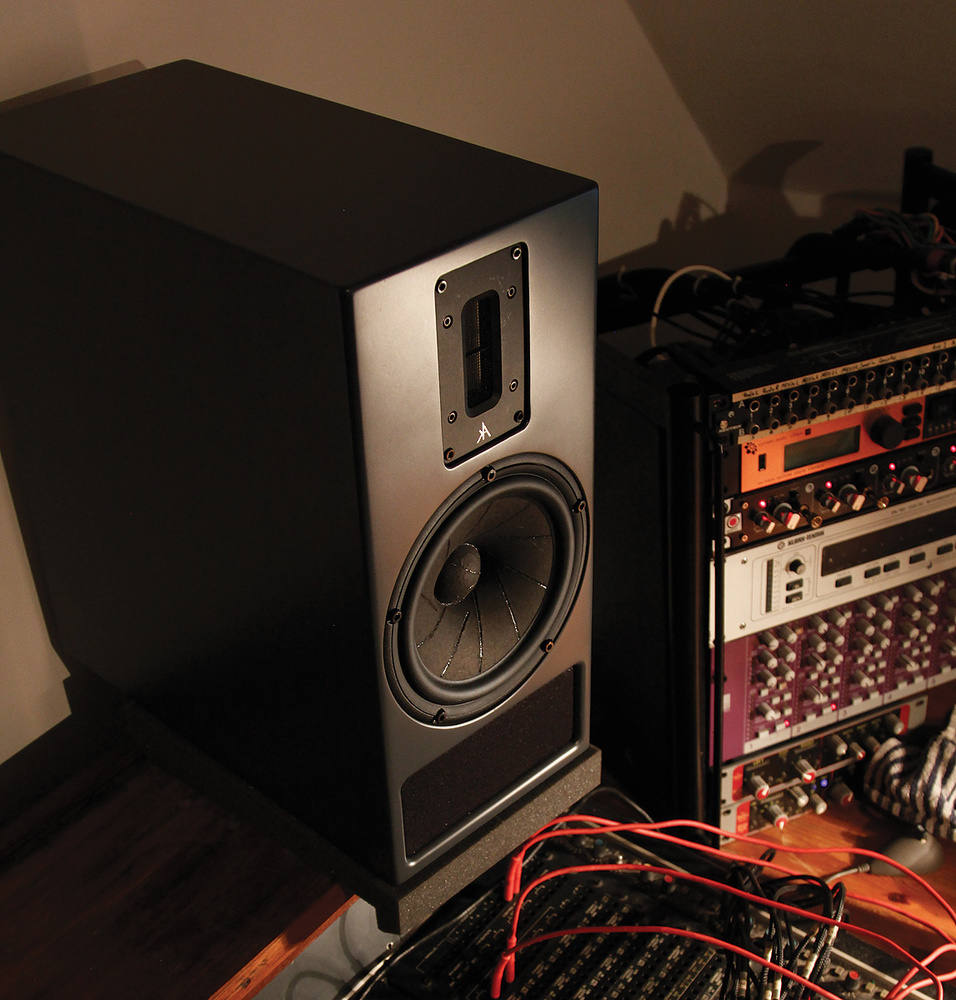
 Acoustical loading from walls and other surfaces can reinforce a speaker's low-frequency response. Most studio monitors therefore offer simple EQ facilities that allow you to adjust the LF response to suit the speaker placement.Acoustical loading from walls and desks that causes a boost in the low-end frequency response can be compensated for with relatively simple low-frequency filters — you'll find these on many speakers at a range of budgets. It's also possible for the designer deliberately to aim for a non-flat anechoic target response. This has usually been done in the past on the assumption that something will happen in the room to recover a flat response. For example, some designers have scooped out the low-mid range, knowing that a desk beneath or in front of them will fill it back in again. This tactic doesn't work if there's no desk (one is left with a speaker response suffering from a scooped low-mid), and with today's active products and user-controlled filters, this shaped-response design ideology is unnecessary.
 While corrective EQ can combat changes in the frequency response due to acoustical loading, removal of other problems born of reflections requires a more complex solution such as Trinnov's ST2 Pro.Reflections cannot be equalised out unless one uses sophisticated echo-cancellation techniques, which are complex to design and expensive to implement. Trinnov make such a system (the SOS review of their ST2 Pro discusses the technology: https://sosm.ag/trinnov-st2-pro), but even with access to such wonders it's better to at least try to acoustically treat the reflecting surfaces, to damp the reflection before employing any signal processing.
What did I mean when I said that the published frequency-response numbers can be misleading? Well, one sees examples like these, which are modelled on those from real manufacturers' websites (the numbers have been changed to protect the guilty!):
40Hz-25kHz. This tells us nothing, because the levels are not specified. Is the response at these frequencies -3dB, -6dB, or even as much as -10dB — or what?
50Hz-22kHz (-6dB). Though slightly better, this is still not great. We know the upper and lower frequencies where the sound pressure is halved. (Often -3dB is quoted, which is half the sound power, but the information limitation is basically the same.) Yet we have no idea what happens between the two specified frequencies.
60Hz-20kHz (±2dB). This is better, as we know that the response between the two frequencies lies within a 4dB window. But we still don't know if the window frames a downward or upward sloped response, a smiley curve, or a ripply, wavy shape.
In short, the only pattern we can deduce from these numbers is that the wider the dB limits, the wider the frequency-response values will be, and the better looking the specifications will seem. You can understand the appeal of such figures to a marketing team, then, but sadly they're not much help to the customer! A more complete, meaningful set of specifications for a single loudspeaker would look like this:
- Anechoic frequency response ±6dB: 40Hz–25kHz
- Anechoic frequency response ±3dB: 45Hz–22kHz
- Anechoic linearity deviation between 100Hz and 10kHz: ±1.5dB
The first two specifications show the frequency extension at high and low frequencies, and the last shows how flat the loudspeaker is in the middle (ie. away from the frequency extremes). Better still would be publication of the original data these numbers are (or should be!) based on — the anechoic frequency-response curve.
 and ideal response (green).") Graph 1: Anechoic response (orange) and ideal response (green).Graph 1 is an example where we can properly see a very flat anechoic response (orange line). Added to the graph is the ideal loudspeaker response (green line). Inside the pass band, the level that's output should be the same at all frequencies, and outside the pass band there should be no sound at all. Incidentally, the low-frequency roll-off slope is a function of the cabinet design: 12dB/octave for a sealed cabinet and 24dB/octave for a vented cabinet. This slope can be (but is not always) increased with filtering used in the crossover, but the steepness of the slope has a side effect (more on that when I discuss 'group delay').
Graph 1: Anechoic response (orange) and ideal response (green).Graph 1 is an example where we can properly see a very flat anechoic response (orange line). Added to the graph is the ideal loudspeaker response (green line). Inside the pass band, the level that's output should be the same at all frequencies, and outside the pass band there should be no sound at all. Incidentally, the low-frequency roll-off slope is a function of the cabinet design: 12dB/octave for a sealed cabinet and 24dB/octave for a vented cabinet. This slope can be (but is not always) increased with filtering used in the crossover, but the steepness of the slope has a side effect (more on that when I discuss 'group delay').
One should also understand that, no matter how good the loudspeaker design is, and how tight one's quality-control systems are, mechanical and electronic parts are not all identical in every produced unit, thereby resulting in small differences in the overall performance. This can be seen as differences in the frequency response from one unit to the next, resulting in a reduced ability to image a source. Consistency can be increased by trimming the response in final testing in production; some manufacturers just adjust driver levels, some do more than this, and others do nothing at all. The target and a measure for this have been proposed in reference paper 1 (see References box), and to date I'm aware of only one studio monitor manufacturer who expresses a tolerance in their public specifications.
The dirty secret for analogue loudspeakers is that the natural phase response is a downward sloping line with increasing frequency.
Phase Response
, corrected response (green), ideal (orange).") Graph 2: Typical analogue phase response (blue), corrected response (green), ideal (orange).Mathematically (bear with me — I've provided formulae for reference, but you won't need to perform any calculations!), frequency response is a complex value; it has real and imaginary components. The 'frequency response' that I've described thus far is actually the magnitude of the frequency response (sqrt(Re2+Im2)). Another view is the phase of the frequency response (sin-1(Im/Re)). The theoretically ideal loudspeaker would produce all frequencies at exactly the same time, and if this were the case, the phase response would be a flat line: 'linear phase'. The dirty secret for analogue loudspeakers is that the natural phase response is a downward sloping line with increasing frequency — the upper plot of Graph 2 is a phase response that has been 'wrapped', to aid showing it on a graph with a smaller Y-axis range. To make the phase flat using analogue electronics is difficult and expensive, so most manufacturers don't bother. (The notable exception is PSI, an example of which is included in the lower plot of Graph 2.)
Graph 2: Typical analogue phase response (blue), corrected response (green), ideal (orange).Mathematically (bear with me — I've provided formulae for reference, but you won't need to perform any calculations!), frequency response is a complex value; it has real and imaginary components. The 'frequency response' that I've described thus far is actually the magnitude of the frequency response (sqrt(Re2+Im2)). Another view is the phase of the frequency response (sin-1(Im/Re)). The theoretically ideal loudspeaker would produce all frequencies at exactly the same time, and if this were the case, the phase response would be a flat line: 'linear phase'. The dirty secret for analogue loudspeakers is that the natural phase response is a downward sloping line with increasing frequency — the upper plot of Graph 2 is a phase response that has been 'wrapped', to aid showing it on a graph with a smaller Y-axis range. To make the phase flat using analogue electronics is difficult and expensive, so most manufacturers don't bother. (The notable exception is PSI, an example of which is included in the lower plot of Graph 2.)
 and ideal phase response (green).") Graph 3: DSP phase response (black) and ideal phase response (green).With DSP loudspeakers the situation is quite different, as a frequency-dependent delay can be applied easily and cheaply using an FIR filter to flatten the phase response, at the cost of some additional latency; the greater the latency that can be accepted, the lower the frequencies that can be flattened. In the example shown in Graph 3, 2ms of latency was the price paid to flatten the phase response down to about 300Hz. At least 50ms would be needed to get a flattening down to 20Hz — that's the kind of latency that's only practical for offline playback applications (eg. listening to a CD), and where the sound relates to video pictures, a corresponding delay would also be needed in the display to maintain lip-sync.
Graph 3: DSP phase response (black) and ideal phase response (green).With DSP loudspeakers the situation is quite different, as a frequency-dependent delay can be applied easily and cheaply using an FIR filter to flatten the phase response, at the cost of some additional latency; the greater the latency that can be accepted, the lower the frequencies that can be flattened. In the example shown in Graph 3, 2ms of latency was the price paid to flatten the phase response down to about 300Hz. At least 50ms would be needed to get a flattening down to 20Hz — that's the kind of latency that's only practical for offline playback applications (eg. listening to a CD), and where the sound relates to video pictures, a corresponding delay would also be needed in the display to maintain lip-sync.
Group Delay
With a bit more maths (the negative slope of the phase response — well you did ask!) we can get the group delay. We can interpret this as the time it takes for the electrical input signal to appear as acoustical sound at the front of the loudspeaker. Ideally it should be a flat line at 0 seconds (green line in Graph 4) but, as you can see, the lower frequencies rise upwards, and this means that it has taken longer for the bass to come out of the loudspeaker than for the mid-range and treble. Insert bass-player joke here. [The author's a bassist, so he's allowed to say that! — Ed] If the phase response can be flattened completely the group delay will also be flattened, but as we cannot advance the bass (which would require new discoveries in physics!) we must delay the other frequencies, resulting in an increase in latency. Anything other than a flat group delay is effectively time distortion.
 and ideal group delay (green).") Graph 4:Group delay (orange) and ideal group delay (green).There's not much research on how low this low-frequency group-delay increase must be to be inaudible so, for now, manufacturers should simply try to minimise it. Products with a lower group delay sound 'faster', 'tighter' or 'drier', and it has been well documented in SOS reviews that sealed cabinets, which naturally have a lower low-frequency group delay, have these sound-quality characteristics. Also, note that the higher the low-frequency cutoff, the lower the group-delay increase will be. This could be one of the reasons why the Yamaha NS10 has proved enduringly popular: it has a high low-frequency corner of about 90Hz (which also means it cannot excite room resonances much), it is a sealed-cabinet design, and has no high-pass bass driver protection filtering. Result: a very low low-frequency group delay. (For more on what made the NS10 a studio favourite, read Phil Ward's SOS article at https://sosm.ag/the-ns10-story.)
Graph 4:Group delay (orange) and ideal group delay (green).There's not much research on how low this low-frequency group-delay increase must be to be inaudible so, for now, manufacturers should simply try to minimise it. Products with a lower group delay sound 'faster', 'tighter' or 'drier', and it has been well documented in SOS reviews that sealed cabinets, which naturally have a lower low-frequency group delay, have these sound-quality characteristics. Also, note that the higher the low-frequency cutoff, the lower the group-delay increase will be. This could be one of the reasons why the Yamaha NS10 has proved enduringly popular: it has a high low-frequency corner of about 90Hz (which also means it cannot excite room resonances much), it is a sealed-cabinet design, and has no high-pass bass driver protection filtering. Result: a very low low-frequency group delay. (For more on what made the NS10 a studio favourite, read Phil Ward's SOS article at https://sosm.ag/the-ns10-story.)