
What do the manufacturer's frequency response figures tell you about your studio monitors? Less than you might think, as Phil Ward discovers... This is the concluding article in a two‑part series.
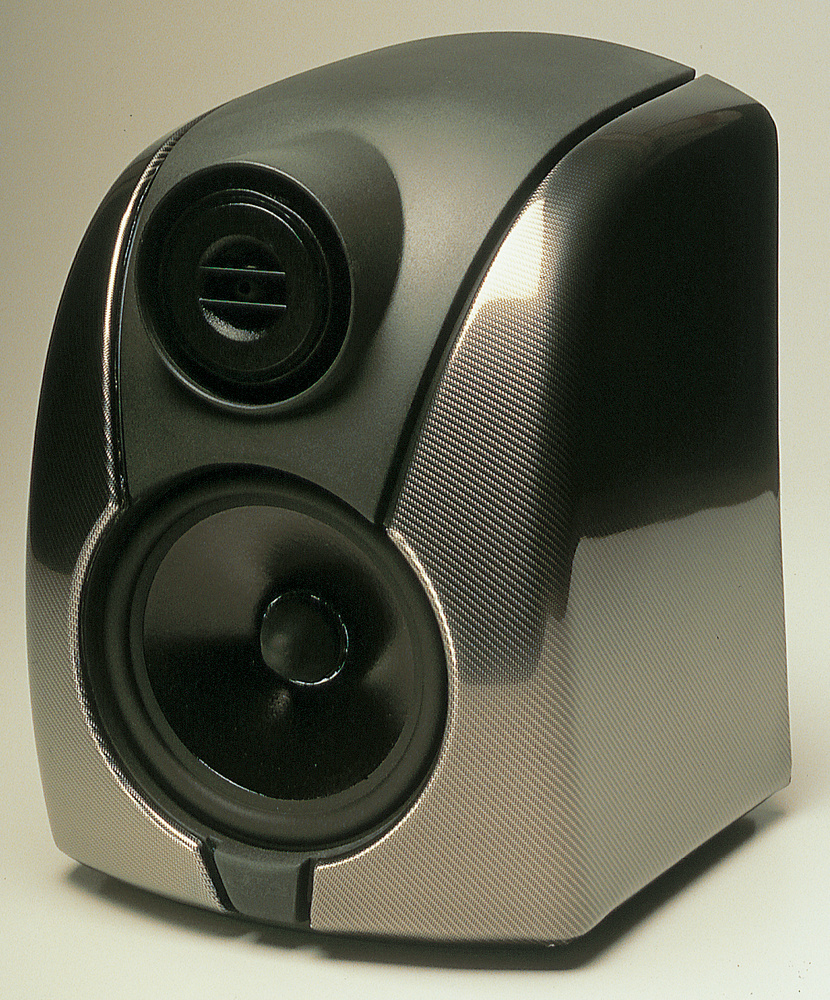
Last month, I began this short series by describing and illustrating how the characteristics of your studio monitors can profoundly affect all that you record. Simply because it seemed logical to start at the bottom, Part 1 dealt with the low end of the audio spectrum. This month, still with the No‑Name Acoustics Nearfield (our average anonymous studio monitor) as willing guinea‑pig, I will attempt to make you aware of how your monitors behave across the rest of the audio frequency band.
High Anxiety

Perhaps the most obvious way in which a speaker imprints its character on music is through its frequency response in the mid to high frequency band — say, 200Hz to 8kHz. This is the region where musical sounds carry the majority of their information and energy, and the region where the performance and integration of the woofer and tweeter are probably the dominant factors. Only probably, though, as there are other dark and mysterious factors to consider. I'll come to those later...
Conclusions are often drawn about the drive units and probable tonal qualities of a speaker from its measured frequency response, and at first glance the concept of frequency response is very simple. In the case of a consumer electronics product, a frequency response that is not flat simply modifies the tonal characteristics of the audio signal. (Applying EQ to a signal is nothing more than intentionally bending the frequency response.)
If only it were thus with speakers. Manufacturers' specifications of frequency response (you know the kind of thing — "50Hz ‑20kHz ±3dB") are such a simplification of the real‑life situation as to be almost meaningless. In fact, they're probably worse than meaningless, as their simplicity lulls us all into a false sense of understanding.
Frequency Facts
There are basically three factors that complicate the issue of interpreting a speaker's frequency response:
* Where? Where was the speaker when its response was measured, and where was the measurement microphone in relation to the speaker?
* When? Was the measured response a short snapshot or the integration (combining and averaging) of signals over some longer time?
* What's listening? How do we correlate a response measurement made via a microphone with the ears and brain of a real person? And remember, as I said in last month's instalment, our ears are cleverer at listening than speakers are at singing.
Location, Location, Location
 Figure 1: Frequency response of No‑Name nearfield measured with microphone at 1m on tweeter axis. The green curve shows response 20 degrees below the tweeter.
'Where' is probably the most straightforward of these three issues, so I'll try to deal with that first. Manufacturers do occasionally supply some 'where' information with published frequency response specifications. They'll say something like, "microphone at 1m on tweeter axis". They might even specify the environment in which the measurement was made. So, just because we still have the No‑Name ready and willing to be subjected to more investigation, let's measure its frequency response with a microphone at 1m on the tweeter axis — which you can see in Figure 1. Looks pretty respectable (50Hz‑20kHz ±3dB) in the context of a device made of wobbling bits of plastic screwed into a chipboard box.
But what happens if we move the microphone? The green overlay on Figure 1 is the frequency response with the microphone still at 1m distance, but moved 20 degrees downward with respect to the tweeter axis. The response is a mess, and two questions probably arise. Firstly, why does moving the microphone by around 25cm turn a nice flat response curve into a section through the Himalayas? And secondly, if you were listening to the speakers and moved your head a similar distance, how come you wouldn't be conscious of such gross tonal changes? After all, if you took a near 10dB chunk out of the signal at 2kHz with an equaliser, you'd hear it!
The answer to the first question is actually pretty straightforward (unlike the answer to the second). The chunk of response missing around 2kis simply caused by destructive interference between the output of the two drive units. Over the region of the speaker's bandwidth, where both drive units contribute to the output (this overlap is illustrated in Figure 2), there will be points in space where the path lengths from each driver differ by multiples of half a wavelength, and, in a throwback to school physics 'ripple tank' experiments, silence breaks out. The second obvious change between the response at two different microphone positions — the faster roll‑off above 10kHz — is caused by the directional characteristics of the tweeter. Any radiating diaphragm will begin to become directional as the wavelength of the radiated energy approaches the size of the diaphragm, and when we moved the microphone 'off axis' the tweeter directionality began to show. With phenomena such as interference and directivity at play, each different microphone position will have a unique frequency response, and the arbitrary choice of "microphone at 1m on tweeter axis" for a specification is just that — arbitrary.
 Figure 2: Frequency response of No‑Name nearfield measured with microphone at 1m on tweeter axis. The green and red curves are the frequency responses of the indvidual drive units. Crossover frequency is 2kHz.Before I move on to answering the second question, Figure 2 and and Figure 3 (the latter being a curve showing the No‑Name's response 20 degrees off‑axis horizontally) reveal something unusual, and perhaps significant, about the speaker's design. Figure 3 shows that the No‑Name is a good performer horizontally off‑axis. The expected roll‑off in very high‑frequency energy is present, but through the mid‑range and driver overlap region the off‑axis and on‑axis curves are pretty close together. The reason for this good behaviour is the choice of a low (2kHz) crossover frequency between the two drivers — 3kHz or above would be more usual — and also the reasonably gentle crossover filter slopes. At 2kHz, firstly, the bass unit is still reasonably non‑directional; and secondly, the wavelength (0.17m) is larger than the distance between the two drivers, which helps to reduce the severity of the cancellation effects mentioned earlier. It's not all good news, though, because a low crossover frequency and a low filter slope (electrically, the high‑pass filter is 6dB/octave) is likely to put the tweeter under significant displacement and thermal stress. I would not be at all surprised to find that the No‑Name displays relatively high levels of distortion around 1‑3kHz, nor to hear that it has a reputation for tweeter failure.
 Figure 3: Frequency response of No‑Name nearfield measured with microphone at 1m on tweeter axis. The green curve shows response 20 degrees horizontally off‑axis.Meanwhile, it's time to answer the second question: why don't we hear the gross off‑axis response changes? The answer is as much associated with the 'When?' and 'What's listening?' questions as it is with the 'Where?' question, and it goes something like this. It's all too easy, when considering the mechanisms of hearing, to rely on the analogy of ear as 'microphone' and brain as 'recorder'. This analogy is not entirely without foundation (on the very basic level of eardrum and microphone diaphragm, for example), but once we start to consider how the brain interprets the ear's 'output', the situation is rather less clear‑cut.
Perhaps the biggest intellectual hurdle to jump is understanding that the brain combines and averages over time over time the signals received from the ear. In the case of a loudspeaker in a room where reflections from walls, floor and ceiling ensure multiple paths from speaker to ear, the tonal balance perceived by a person in the room is made up from the integrated average of many different 'frequency responses', all arriving at different times. The integration 'window' is around 15mS wide, but varies with person and frequency. This is why we're not really aware of the gross response anomalies that are often revealed by a single frequency response measurement and, similarly, why we can perceive a speaker as highly coloured when its axial frequency response appears to be flat (take a bow, the majority of horn‑loaded speakers). This psychoacoustic integration phenomena has some significant implications for the design of monitors and how we use them. I'm sure you knew there was going to be a point to all this!
Practical Magic
Find out a little about the off‑axis response of your monitors. Don't necessarily mistrust a published specification but treat it as the marketing material it almost certainly is. You can work out much of what you need to know simply by looking. If you have monitors with a large bass/mid driver (say, 200mm or more) and a high crossover frequency (above 3kHz) you can be pretty certain that, however flat the axial frequency response, the off‑axis response won't be. Conversely if your monitors have a smaller bass/mid unit and a lower crossover frequency they'll in all probability be better behaved off‑axis.
 Does your room or monitor setup encourage strong early reflections? A monitor with poor horizontal off‑axis performance, positioned relatively close to a side wall, is likely to sound coloured through the mid‑range, because a large proportion of the sound you hear is actually the reflected off‑axis response. Try changing the inward angle of the monitors — aim them either towards a point well in front of the listening position or aim them both straight out into the room. The mid coloration might just be suppressed as you change the response shape of the side‑wall reflections. Remember, though, that if you're no longer listening on the tweeter axis the overall balance might become a little less bright.
Don't ask me why, but many people seem to think the natural position for speakers is on the shorter wall firing down the room. Quite often, however, they'll work better on the long wall firing across the room, simply because the first side‑wall reflection will then be less prominent at the listening position.
Could you suppress early side‑wall reflections by the strategic application of some diffusing and/or absorptive material? It's pretty easy to work out the region of the side walls that will generate a strong reflection to your listening position, so a quick experiment with a folded duvet hung in the right place might show that a tonal problem you've been equalising for years is actually a monitor dispersion artifact. Careful, though — over‑damp the room and you'll end up mixing everything too bright and adding too much reverb.
I'd never advocate turning a typical pair of nearfield monitors on their sides (if that's how you use yours, you really will be fighting against dispersion quirks), but doing so is an interesting experiment, because it may help you understand how your monitor dispersion and listening‑room characteristics influence the sounds that you record. Listen for changes in tonal quality and coloration through the mid‑band with monitors horizontal and then vertical. Perhaps you could record a little spoken voice and use it as a monitor coloration test.
Delayed Reaction
 Figure 4: Waterfall plot of No‑Name nearfield. The speaker output is decaying following a wide‑band noise signal.A further significant frequency response 'When' issue is illustrated by Figure 4. This is a 'waterfall' plot of the No‑Name monitor, from 200Hz to 12kHz, showing that it's not only bass players who suffer from 'extras' added by the monitors (see last month's instalment). A waterfall plot can be pictured as a series of frequency response 'slices' recorded in the few milliseconds after a speaker stops playing a wide‑band noise signal. Time runs on the Z axis, where the curve at the back (at 0mS) is the steady‑state frequency response of the speaker. The plot for the No‑Name shows that there's still a healthy mid‑range output 3mS or so after everything should have stopped. This delayed output is down to three primary causes:
1. Resonance effects in the bass/mid driver cone and surround. For as long as speaker designers have been plying their trade, the search has been on for the perfect material for a speaker cone (or diaphragm, as the better‑educated prefer to call them). This material would cost the same as cardboard, have the density of air, and possess a stiffness tending towards infinity. Any speaker designer who found such a material would, of course, immediately stop designing speakers and make trillions in more profitable fields from such a remarkable discovery.
In the absence of this material, however, as frequency rises and a cone is asked to accelerate more and more rapidly, there comes a point where it stops moving as a single entity and enters an often resonant mode of behaviour known as 'break‑up'. Break‑up simply describes the behaviour of the cone above the level where its mechanical stiffness can withstand the forces of acceleration.
 Two mechanisms come to the rescue of the speaker designer and allow a cone to work at frequencies above break‑up. The first is the inherent self‑damping of the material. Bells ring because they have little self‑damping. Make a bell from a typical speaker‑cone material and — well, not too many folk are going to come to church. It's no coincidence that speaker designers attracted by the lowish density and high stiffness of aluminium find, once they have a working cone, that it demonstrates a variety of high‑Q resonant modes (often referred to as bell modes) above its break‑up frequency.
The second mechanism is the edge damping offered by the cone's surround (usually made of a natural rubber, but sometimes polyurethane foam or a PVC‑derivative material). This, however, is notoriously hard to get exactly and consistently right, and it's often the case that a material which offers good damping properties above break‑up is hopelessly stiff and sluggish at low frequencies.
2. Diffraction effects from the edges of the cabinet. (The edges behave as secondary acoustic sources, and as they're further from the microphone their energy arrives later). It's an inescapable fact that speakers, even professional monitor speakers, haven't shaken off their furniture heritage. There's a long tradition and production infrastructure of cabinet‑making in the design and manufacture of speakers, and this encourages rectilinear shapes with sharp edges. Trouble is, sharp and rectilinear are exactly the characteristics that encourage edge diffraction. Radiusing the edges can help, but to improve matters at anything other than very high frequencies the radii values required are usually well beyond the capabilities of cost‑effective woodwork. And before you go away and start designing a range of extravagantly curved speaker enclosures, you wouldn't be the first. It seems that folk like their speakers to be furniture‑style, and companies that have gone the curved route have, by and large, found it to be a downward curve.
3. The cabinet walls themselves moving in response to the mechanical vibrations of the drivers. This phenomenon is a subject in itself, because a simple calculation comparing the total area of the cabinet walls to the radiating area of the drivers shows that one is over 40 times the other. And it doesn't need a genius to appreciate that a surface 40 times the area of the bass/mid driver doesn't need to move much to generate significant acoustic energy. There seems to be a far greater emphasis on reducing the resonant contribution of the cabinet among hi‑fi speaker designers than among those working in professional audio. Maybe pro‑audio will catch up one day — not that the efforts or techniques of hi‑fi folk have often been particularly successful!
There are many different engineering approaches to solving problem number three. However, the two that really stand a chance of working — very hi‑tech enclosure materials or sophisticated mechanical isolation techniques — are far too expensive to implement in the tight‑margin world of small nearfield monitors. The job needs that same cheap, light, stiff material as the cone, really — just as long as it will take a real wood veneer....
Compression Point
There's just one further phenomenon that I want to cover before you lose all faith in the noise your monitors seem to think is the music you recorded. It's compression again. In Part 1, I described the mechanism of port compression in reflex‑loaded monitors. This time it's the turn of wide‑band compression, the cause of which is predominantly heat
 Figure 5: Difference between the No‑Name nearfield's axial frequency response at 6V and 1V drive levels, showing 0.5dB of compression in the mid band.Around 99 percent of the power your amplifier delivers into your monitors is dissipated as heat, and as various components within the speakers warm up they begin to distort its frequency response. Figure 5 shows the result of subtracting a No‑Name frequency response curve measured at 6V (4.5W into 8Ω) from one measured at 1V (0.125W into 8Ω). Ideally, Graph E would be a straight line at 0dB, but already the temperature rise in the bass unit's voice‑coil has caused its electrical resistance to increase and the driver's output level to compress by half a dB. Higher drive levels can cause the voice‑coil to reach 200‑300°C and can very easily result in two or three dBs of compression.
But simple, wide‑band compression isn't the only mechanism at play. The crossover filter circuits in passive speakers are dependent for their response accuracy on the input impedance presented by the drive unit. As the voice‑coil resistance increases with temperature, the effective filter response's shape can stray very far from that intended and can introduce all sorts of errors in the system response. These thermal compression effects are notoriously difficult to predict or tie down — they are entirely signal and signal‑history dependent, for a start. For example, if you drive a monitor hard from cold, thermal compression won't occur until the temperature has 'caught up'. Similarly, if you have been monitoring at high levels and suddenly turn everything down, the response distortions resulting from the high level will persist, as the voice‑coils take a while to cool.
The ideal solution to these effects is, of course, for designers to do their job properly and engineer speakers such that thermal compression doesn't occur. If only it were that easy. In terms of adding manufacturing and component cost, minimising thermal compression is, after fixing the cabinet resonance, about as expensive a design aim as you can get. And, of course, compression is a hidden effect — it happens without you being specifically aware of it but profoundly influences the way you mix. If memory serves me correctly, the issue of monitors wielding influence over the way you mix is where I came in...
Thanks to Phil Knight for his help in generating the measurements used in this article.